
App debugging is one of the hot topics in our industry. Most of us know how to debug web applications using Chrome extensions, Tag Assistant, DevTools, etc. in terms of tracking implementation, but the subject of app debugging is still a bit blurry.
For example, if you want to see what data the webview sends to Google Analytics using the measurement protocol, this approach will allow you to debug it.
Let’s delve into the subject slowly…
Types of mobile applications
If you want to debug an app, first of all, you should know its ‘type’ because the debugging processes are completely different for each one.
WebView Apps
A webview app is essentially an application that opens a web application in a browser without a adress bar. These types of applications generally have native components for search, navigation, menus, settings, etc. while the rest of the application displays a web application within a webview.

Native Apps
A native app is essentially an app where a web view is not utilized. This type of mobile application won’t display any web pages, and all the elements you see come from the iOS / Android component libraries.

I will be focusing on webview debugging in this article, but I am also planning to write a comprehensive piece on native app debugging.
How do you inspect a WebView?
As you know, we are capable of inspecting regular web pages in browsers. With this capability, we can essentially:
- Reach the console
- Inspect variables
- Execute any JavaScript command
- Examine the network section to observe network requests
- Edit, delete, or add cookies, local storage, or session storage items
- And more
All of the items mentioned above are truly important when debugging an application.
To inspect WebViews on Android and iOS devices, we need to follow similar steps, but each device has different access points. Therefore, I will begin by explaining the process for Android first.
Inspect an Android WebView using the Chrome browser
Well, I am not sure if there are still people who use an Android device like me, but it is mandatory to know how to debug it.
- Make sure that WebView debug mode is activated : This is the first thing you need to ensure before starting debugging. Unfortunately, you should ask developers to add the following configuration to the app first to be able to use the WebView inspect function.
if (Build.VERSION.SDK_INT >= Build.VERSION_CODES.KITKAT) {
    WebView.setWebContentsDebuggingEnabled(true);
}
for more details please visit : https://developer.chrome.com/docs/devtools/remote-debugging/webviews/
- Enable ‘Developer options’ on your Android device : Go to Settings > About phone > Build number on your Android device and tap multiple times on the title. You will see the text ‘developer options activated’ when it is enabled.
- Enable ‘USB debugging’ : Go to Settings > System > Advanced > Developer Options > USB debugging and activate it.
- Connect your Android device to your computer using a USB cable : Google Chrome requires your device to be connected via USB in order to inspect it.
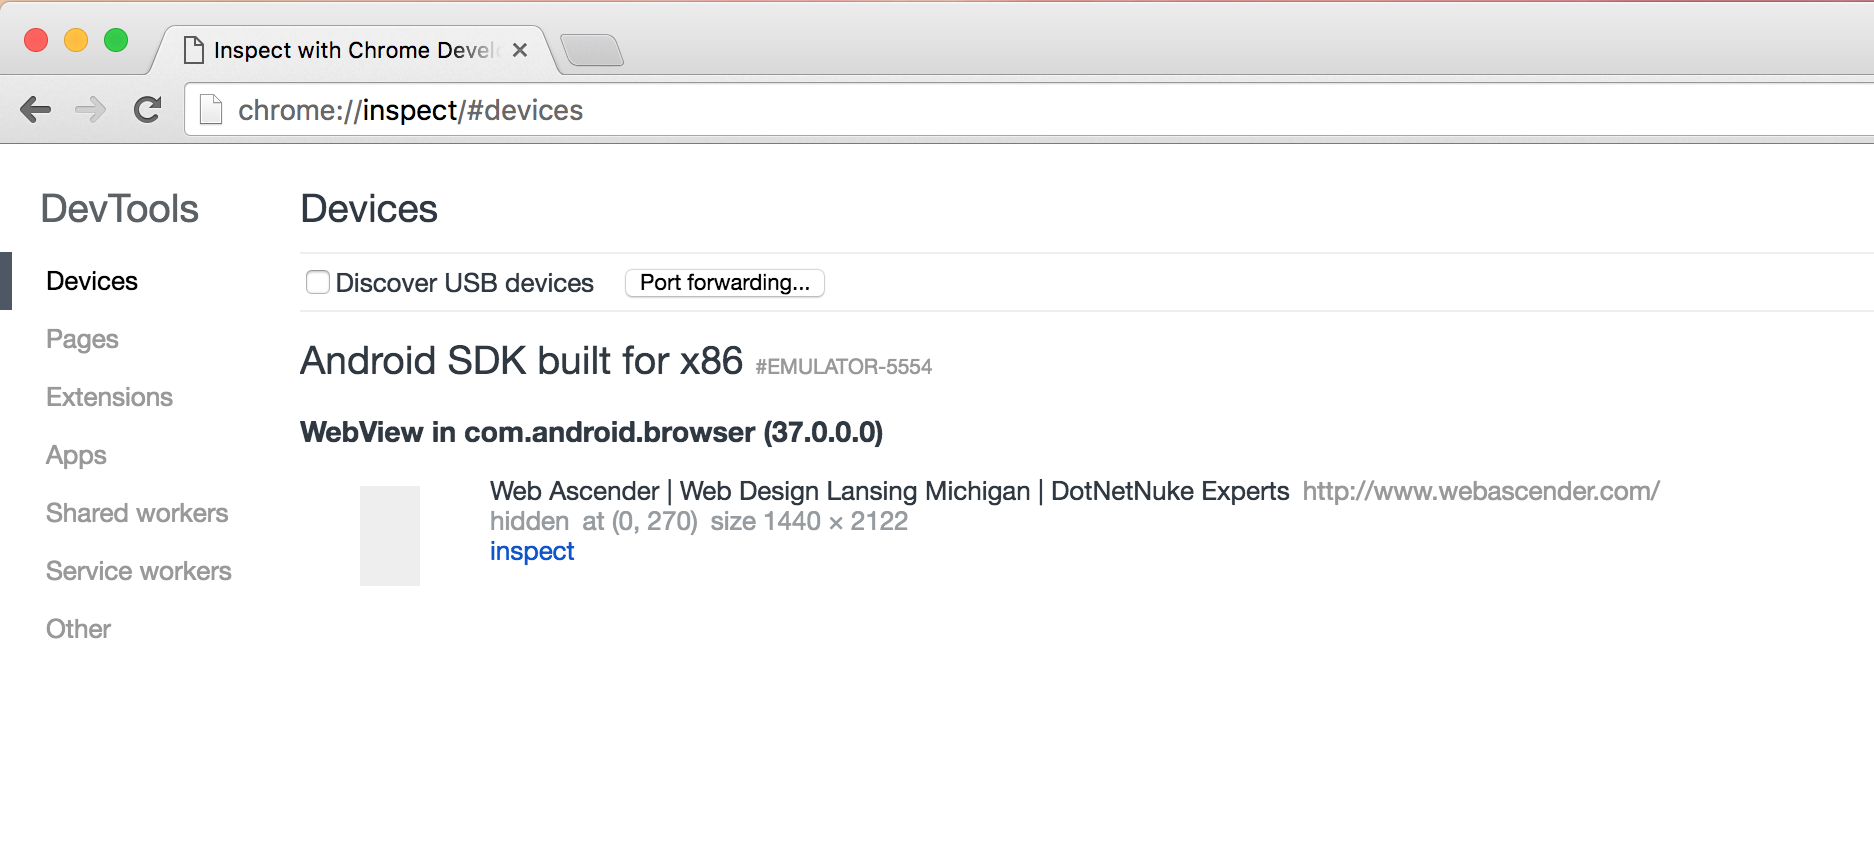
- Go to the inspect setting page in your Chrome browser : Visit : chrome://inspect#devices and be sure to activate the `Discover USB Devices` option, allowing Google Chrome to start scanning for connected USB devices.
- Locate your Android device’s name on the page : If you have set up everything correctly, your device name should be visible on the page.
- Open your WebView app to which you’ve added the code for enabling WebView debugging: You should see the WebView address below the ‘Remote Target’ text. Please click the ‘Inspect’ button.
That’s all! You are now ready to debug your Android WebView app using Chrome!
Inspect an iOS WebView using the Safari browser

It is much easier compare to Android debug process. You will be able to enable inspect mode for iOS WebViews.
- Make sure that you have enabled WebView debug mode : You need to configure your MKWebView to enable the ‘inspectable‘ mode. Add the following code if you are working with Swift.
let webConfiguration = WKWebViewConfiguration()
let webView = WKWebView(frame: .zero, configuration: webConfiguration)
webView.isInspectable = true
for more details please visit : https://webkit.org/blog/13936/enabling-the-inspection-of-web-content-in-apps/
- Connect the iOS device to your Mac using a Type-C cable: Similar to Android, you need to connect your iPhone and Mac in order to inspect using Safari.
- Grant permission for the inspector on your iOS device: Navigate to Settings > Safari > Advanced and activate the ‘Web Inspector’ option.
- Enable the ‘Develop menu’ in Safari on your MAC : Open Safari > Preferences > Advanced and activate the ‘Show Develop menu in menu bar’ option.
- Open the WebView app for which you added debugging code: Open the WebView app that you intend to inspect or debug.
- Open Safari Inspector : Navigate to Safari > develop and you will find your device name along with the open WebView.
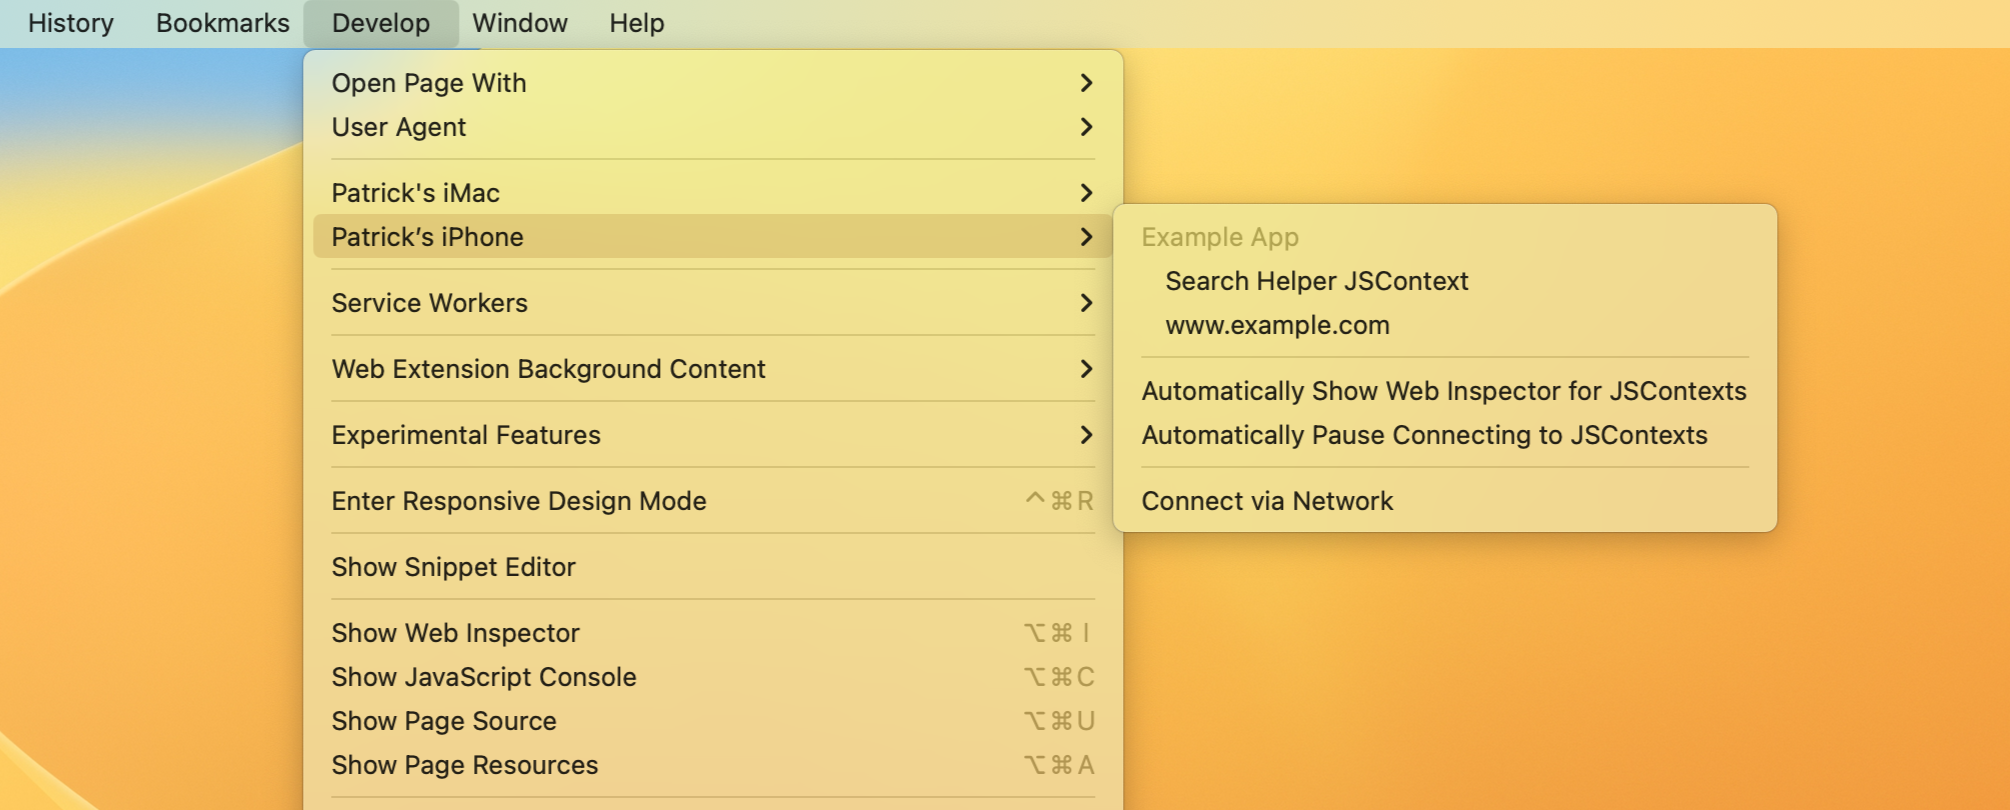
That concludes the process; you now have access to the inspector for debugging your app! Feel free to reach out if you have any questions or comments.
Happy debugging !